Use Cases
- Example of use: Titanic’s statistics by gender
- Example of use: Predicting the survival of Titanic passengers
Example of use: Titanic’s statistics by gender
The following code is an example of how to use this library for Data Science purposes. In this example, we want to know the number of men, women and children who survived or died in the Titanic crash.
In the first part, we will perform some pre-processing (remove some columns, clean some rows that have missing values, replace some value and filter rows) and after that, aggregate the information for adult women.
For explanatory aspects, the input data (Pandas DataFrame) is distributed by COMPSs in 4 fragments using parallelize(). At this point, the programmer no longer has to worry about partitioning the data. All operations will be able to work transparently to the user. The COMPS tasks will be executed in parallel, one for each fragment.
from ddf_library.ddf import DDF
import pandas as pd

df = pd.read_csv('tests/titanic.csv', sep='\t')

ddf1 = DDF().parallelize(df, num_of_parts=4)\
    .select(['Sex', 'Age', 'Survived'])\
    .clean_missing(['Sex', 'Age'], mode='REMOVE_ROW')\
    .replace({0: 'No', 1: 'Yes'}, subset=['Survived'])

ddf_women = ddf1.filter('(Sex == "female") and (Age >= 18)').\
    aggregation(group_by=['Survived'],
                exprs={'Survived': ['count']},
                aliases={'Survived': ["Women"]})

print ddf_women.show()
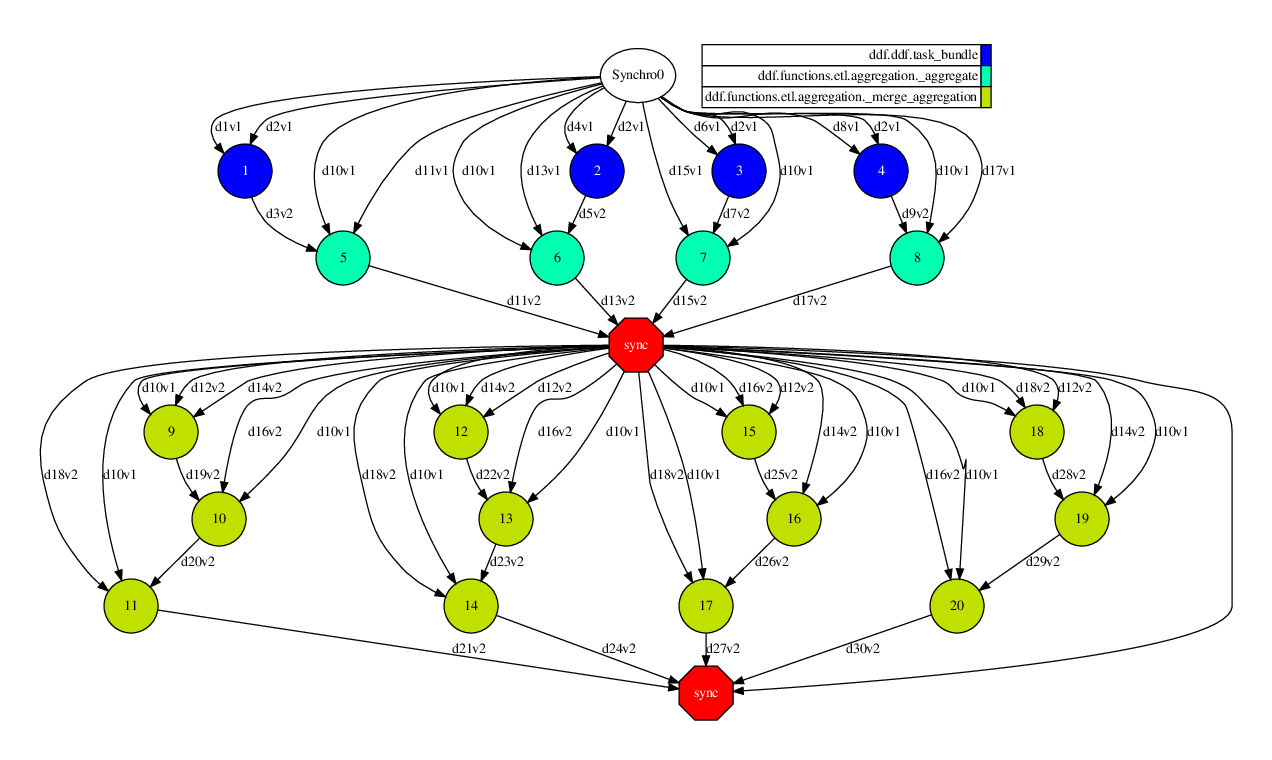
The image shows the DAG created by COMPSs during the execution. The operations select(), clean_missing(), replace() and filter() are some of them that are ‘one processing stage’ and then, the library was capable of group into a single COMPSs task (which was named task_bundle). In this DAG, the other tasks are referring to the operation of aggregation(). This operations needs certain exchanges of information, so it performs a synchronization of some indices (light data) for submit the minimum amount of tasks from master node. Finally, the last synchronization is performed by show() function (which is an action) to receives the data produced.
Next, we extend the previous code to computate the result also for men and kids.
from ddf_library.ddf import DDF
import pandas as pd

df = pd.read_csv('tests/titanic.csv', sep='\t')

ddf1 = DDF().parallelize(df, num_of_parts=4)\
    .select(['Sex', 'Age', 'Survived'])\
    .clean_missing(['Sex', 'Age'], mode='REMOVE_ROW')\
    .replace({0: 'No', 1: 'Yes'}, subset=['Survived']).cache()

ddf_women = ddf1.filter('(Sex == "female") and (Age >= 18)').\
    aggregation(group_by=['Survived'],
                exprs={'Survived': ['count']},
                aliases={'Survived': ["Women"]})

ddf_kids = ddf1.filter('Age < 18').\
    aggregation(group_by=['Survived'],
                exprs={'Survived': ['count']},
                aliases={'Survived': ["Kids"]})

ddf_men = ddf1.filter('(Sex == "male") and (Age >= 18)').\
    aggregation(group_by=['Survived'],
                exprs={'Survived': ['count']},
                aliases={'Survived': ["Men"]})

ddf_final = ddf_women\
    .join(ddf_men, key1=['Survived'], key2=['Survived'], mode='inner')\
    .join(ddf_kids, key1=['Survived'], key2=['Survived'], mode='inner')

print ddf_final.show()
This code will produce following result:
| Survived | Women | Men | Kids |
|---|---|---|---|
| No | 8 | 63 | 14 |
| Yes | 24 | 7 | 10 |
Example of use: Predicting the survival of Titanic passengers
In this second challenge, based in this blog-post, we want to predict whether a passenger on the titanic would have been survived or not.
First of all, we need to remove some columns (Passenger id, Cabin number and Ticket number) and remove rows with missing values. After that, we need to convert the Sex column to numeric. Because we know all possible values (male or female), we can use a simple replace function to convert them. Name, Age and Fare columns had their values categorized. And finally, we used a StringIndexer to convert Embarked to convert this column to indexes.
After that, we put together all columns (except Survived, which will be the label) in a feature vector and normalize them using Standardscaler. Finally, we divide this data into one part with 70% and 30%. The first part (70%) is used in the classifier (LogisticRegression) training stage and the others 30% is used to test the fitted model. At end, the model can be evaluated by some binary metrics.
df = pd.read_csv('tests/titanic.csv', sep='\t')

titles = {"Mr": 1, "Miss": 2, "Mrs": 3, "Master": 4, "Rare": 5}

def title_checker(row):
    for title in titles:
        if title in row['Name']:
            return titles[title]
    return -1

def age_categorizer(row):
    category = 7

    if row['Age'] <= 11:
        category = 0
    elif (row['Age'] > 11) and (row['Age'] <= 18):
        category = 1
    elif (row['Age'] > 18) and (row['Age'] <= 22):
        category = 2
    elif (row['Age'] > 22) and (row['Age'] <= 27):
        category = 3
    elif (row['Age'] > 27) and (row['Age'] <= 33):
        category = 4
    elif (row['Age'] > 33) and (row['Age'] <= 40):
        category = 5
    elif (row['Age'] > 40) and (row['Age'] <= 66):
        category = 6

    return category

def fare_categorizer(row):
    category = 5
    if row['Fare'] <= 7.91:
        category = 0
    elif (row['Fare'] > 7.91) and (row['Fare'] <= 14.454):
        category = 1
    elif (row['Fare'] > 14.454) and (row['Fare'] <= 31):
        category = 2
    elif (row['Fare'] > 31) and (row['Fare'] <= 99):
        category = 3
    elif (row['Fare'] > 99) and (row['Fare'] <= 250):
        category = 4
    return category

features = ['Pclass', 'Sex', 'Age', 'SibSp', 'Parch', 'Fare', 'Embarked']
all_columns = features + ['Survived']

ddf1 = DDF().parallelize(df, num_of_parts=4)\
    .drop(['PassengerId', 'Cabin', 'Ticket'])\
    .clean_missing(all_columns, mode='REMOVE_ROW')\
    .replace({'male': 1, 'female': 0}, subset=['Sex'])\
    .map(title_checker, 'Name')\
    .map(age_categorizer, 'Age')\
    .map(fare_categorizer, 'Fare')

from ddf_library.functions.ml.feature import StringIndexer
ddf1 = StringIndexer(input_col='Embarked',
                     output_col='Embarked').fit_transform(ddf1)

# assembling a group of attributes as features and removing them after
from ddf_library.functions.ml.feature import VectorAssembler
assembler = VectorAssembler(input_col=features, output_col="features")
ddf1 = assembler.transform(ddf1).drop(features)

# scaling using StandardScaler
from ddf_library.functions.ml.feature import StandardScaler
ddf1 = StandardScaler(input_col='features', output_col='features')\
    .fit_transform(ddf1)

# 70% to train the model and 30% to test
ddf_train, ddf_test = ddf1.split(0.7)

print "Number of rows to fit the model:", ddf_train.count()
print "Number of rows to test the model:", ddf_test.count()

from ddf_library.functions.ml.classification import LogisticRegression
logr = LogisticRegression(feature_col='features', label_col='Survived',
                          max_iters=10, pred_col='out_logr').fit(ddf_train)

ddf_test = logr.transform(ddf_test).select(['Survived', 'out_logr'])

from ddf_library.functions.ml.evaluation import BinaryClassificationMetrics

metrics_bin = BinaryClassificationMetrics(label_col='Survived',
                                          true_label=1.0,
                                          pred_col='out_logr',
                                          data=ddf_test)

print "Metrics:\n", metrics_bin.get_metrics()
print "\nConfusion Matrix:\n", metrics_bin.confusion_matrix
This code will produce following result:
Metrics:
| Metric | Value |
|---|---|
| Accuracy | 0.921053 |
| Precision | 0.785714 |
| Recall | 1.000000 |
| F-measure (F1) | 0.880000 |
Confusion Matrix:
| 0.0 | 1.0 | |
|---|---|---|
| 0.0 | 24 | 0 |
| 1.0 | 3 | 11 |